CSPF Neighbors
These displays provide detailed data and statuses for CSPF neighbor brokers. You can check trends on network traffic among CSPF neighbors. Note that these displays are empty if you are only monitoring Solace Cloud PubSub+ Brokers. Displays in this View are:
| • | Neighbors Table: View metrics for Solace neighbor brokers that use the Content Shortest Path First (CSPF) routing protocol to determine the shortest path in which to send messages from one broker to another broker in the Solace network. |
| • | CSPF Neighbors Diagram: Topological view of CSPF Neighbors that shows broker connections and status of servers (Active/Inactive). |
| • | Neighbors Summary: View detailed performance metrics for a single Solace neighbor broker that uses the CSPF routing protocol. |
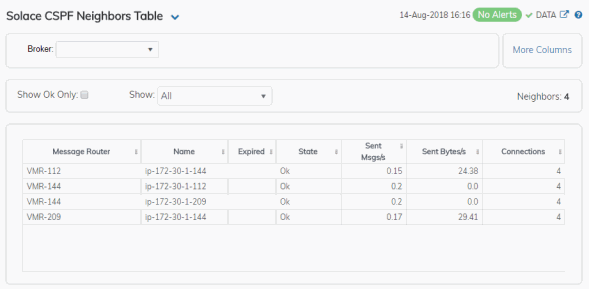
Neighbors Table
This tabular display shows Content Shortest Path First (CSPF) neighbor metrics for a broker. Each row in the table is a neighbor link. Select a broker from the drop-down menu. View metrics for a Solace neighbor broker that uses the CSPF routing protocol to determine the least cost path in which to send messages from one broker to another broker in the Solace network.
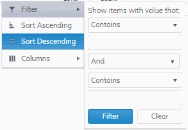
Search by clicking the right side of a column heading/Filter to open the Search, Sort and Choose Columns dialog:
By default, a subset of available metrics is shown. Use More Columns/Less Columns to toggle to the complete set of metrics available (and back to the subset).
|
|
Neighbor Count: |
The number of neighbor brokers connected to the selected Broker. |
||
|
|
Show: |
OK |
Select to only show neighbor brokers that are connected (State is OK). By default, this option is not selected (all neighbor brokers are shown. |
|
|
|
|
Expired |
Select to show both expired and non-expired neighbor brokers. By default, this option is not selected (only non-expired neighbor brokers are shown). |
|
|
Table: Each table row is a different neighbor broker. |
||||
|
|
Broker |
The name of the neighbor broker. |
||
|
|
State |
The current state of the neighbor link. |
||
|
|
Up Time |
The amount of time the broker has been up and running. |
||
|
|
Connections |
The number of connections. |
||
|
|
Link Cost Actual |
Refer to Solace documentation for more information. |
||
|
|
Link Cost Configured |
Refer to Solace documentation for more information. |
||
|
|
Data Port |
Refer to Solace documentation for more information. |
||
|
|
Expired |
When checked, performance data about the broker has not been received within the time specified. |
||
|
|
Timestamp |
The date and time the row of data was last updated. |
||
CSPF Neighbors Diagram
Use this topology display to monitor the health of network components: Solace brokers, VMRs, servers and neighbor links. Quickly identify broker neighbors that are inactive and which resources their performance impacts.
Each node in the display is a Solace broker, VMR or server. The lines connecting nodes represent neighbor links.
Drag and drop objects to arrange them on the screen (doing so does not logically impact Solace brokers, software or servers).
This display only shows items that are categorized as Appliance, Appliance-Pair, VPN, ApplianceCapacity, Client, Bridge or Endpoint. And when you click  to open the Alerts Table by Component display and investigate alerts, only alerts for items in these categories are listed.
You can mouse-over objects to see their Host IP address and Platform. Right-click on VMR objects and select Open VMR UI to open the Solace VMR login web page. Double-click to drill down and investigate in the Neighbors Table.
(Please scroll down for details about using the tool bar.)
View Options

|
Toggle the visibility of the overview panel. | |

|
Zoom in on the diagram by 25% | |

|
Zoom out on the diagram by 25% |
The overview on/off option is persistent for a browser session. For example if you toggle the overview on it will remain on even if you navigate to another display and then back to the diagram later.
The zoom level is not persistent, it is reset to 100% each time you navigate to a the diagram display.
Neither the overview toggle or the zoom level are saved with the diagram layout options (described below).
Layout Options

|
Select a layout type to apply to the diagram. You can also click and drag the nodes to lay them out manually.
|
|||||||||

|
Apply the selected layout type. This is useful to restore the layout after clicking and dragging the nodes e.g. if you want to start over. | |||||||||

|
Use a horizontal flow (applies to tree and graph layout only). | |||||||||

|
Use a vertical flow (applies to tree and graph layout only). | |||||||||

|
Save the layout options including the positions of any manually moved nodes to the local browser storage. This will be used instead of the default layout whenever you view this diagram in the browser where it was saved. | |||||||||

|
Restore the layout options in the toolbar to the locally saved layout if there is one otherwise to the selected layout. | |||||||||

|
Delete the locally saved layout options |
Broker object shape (and icon) indicates broker type
|
PubSub+ Cloud Broker |
|
PubSub+ Appliance Broker |
|
PubSub+ Software Event Broker (or any other type not listed above) |
|
unrecognized broker connection |
Broker object color indicates data server connection status:
| • | dark green: broker is connected to data server and data was recently received from broker |
| • | light green: broker is not connected to data server |
| • | gray: broker is marked as expired (connected but no recent data received) |
Broker border indicates HA status:
| • | solid thin blue border: standalone broker |
| • | solid thick blue border: broker is part of HA pair, redundancy is enabled |
| • | dashed thick blue border: broker is part of HA pair, redundancy is not enabled (i.e. mate not ready) |
| • | solid thick blue border: broker is part of HA pair, redundancy is enabled |
Link color indicates the state of the connection:
| • | green: the state is OK |
| • | gray: the state is Connecting or otherwise |
To monitor network bridges and VPNs, see the Bridges Diagram.
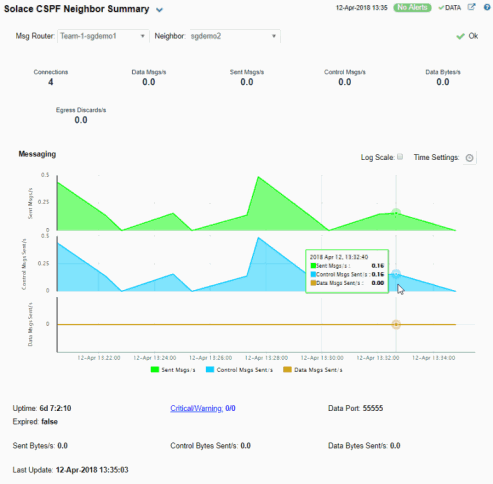
Neighbors Summary
View neighbor broker current configuration details and message throughput rates.
Select a broker and a neighbor broker from the drop down menus. Check message throughput rates to the neighbor broker, as well as neighbor Up Time, State, Data Port, number of connections and link costs.
You can hover over the metric cards to see more performance metrics and also drill down to see even more detail by clicking on them.
The bottom half of the display provides current and historical performance metrics for the selected broker. The trend graph traces the performance metric you select: Message Flow or Throughput.
You can hover over the trend graph to see the values at a particular time. You can specify the time range for the trend graph and view data based on a log scale, which enables visualization on a logarithmic scale and should be used when the range in your data is very broad.
The trend graph traces the current and historical message throughput (Data, Control, Discards and Total).
|
|
Neighbor: |
Select the neighbor broker for which you want to show data in the display. |
|||||||||||
|
|
Connections |
The current number of connections. |
|||||||||||
|
|
Data Msgs/s |
Refer to Solace documentation for more information. |
|||||||||||
|
|
Sent Msgs/s |
Refer to Solace documentation for more information. |
|||||||||||
|
|
Control Msgs/ s |
Refer to Solace documentation for more information. |
|||||||||||
|
|
Data Bytes/s |
Refer to Solace documentation for more information. |
|||||||||||
|
|
Egress Discards/s |
The total number of discarded messages sent from the selected Broker to the selected Neighbor broker since the broker was last started. |
|||||||||||
|
Trend Graphs Traces the rates of messages sent from the selected Broker to the selected Neighbor broker. |
|||||||||||||
|
|
Sent Msgs/s |
Refer to Solace documentation for more information. |
|||||||||||
|
|
Control Msgs/s |
Refer to Solace documentation for more information. |
|||||||||||
|
|
Discards/s |
Traces the number of discarded messages sent, per second, from the selected Broker to the selected Neighbor broker. |
|||||||||||
|
|
Log Scale |
Select to enable a logarithmic scale. Use Log Scale to see usage correlations for data with a wide range of values. For example, if a minority of your data is on a scale of tens, and a majority of your data is on a scale of thousands, the minority of your data is typically not visible in non-log scale graphs. Log Scale makes data on both scales visible by applying logarithmic values rather than actual values to the data. |
|||||||||||
|
|
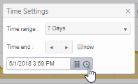
Time Settings |
By default, the time range end point is the current time. To change the time range, click the Time Settings
Toggle forward/backward in the trend graph per the period you choose (from the Time range drop-down menu) using arrows Restore settings to current time by selecting now
|
|||||||||||

 .
.
 .
. .
.